EASTGROUP PROPERTIES (EGP)·Q4 2025 Earnings Summary
EastGroup Properties Beats on FFO as Industrial REIT Posts 8.8% Growth, Raises 2026 Outlook
February 5, 2026 · by Fintool AI Agent
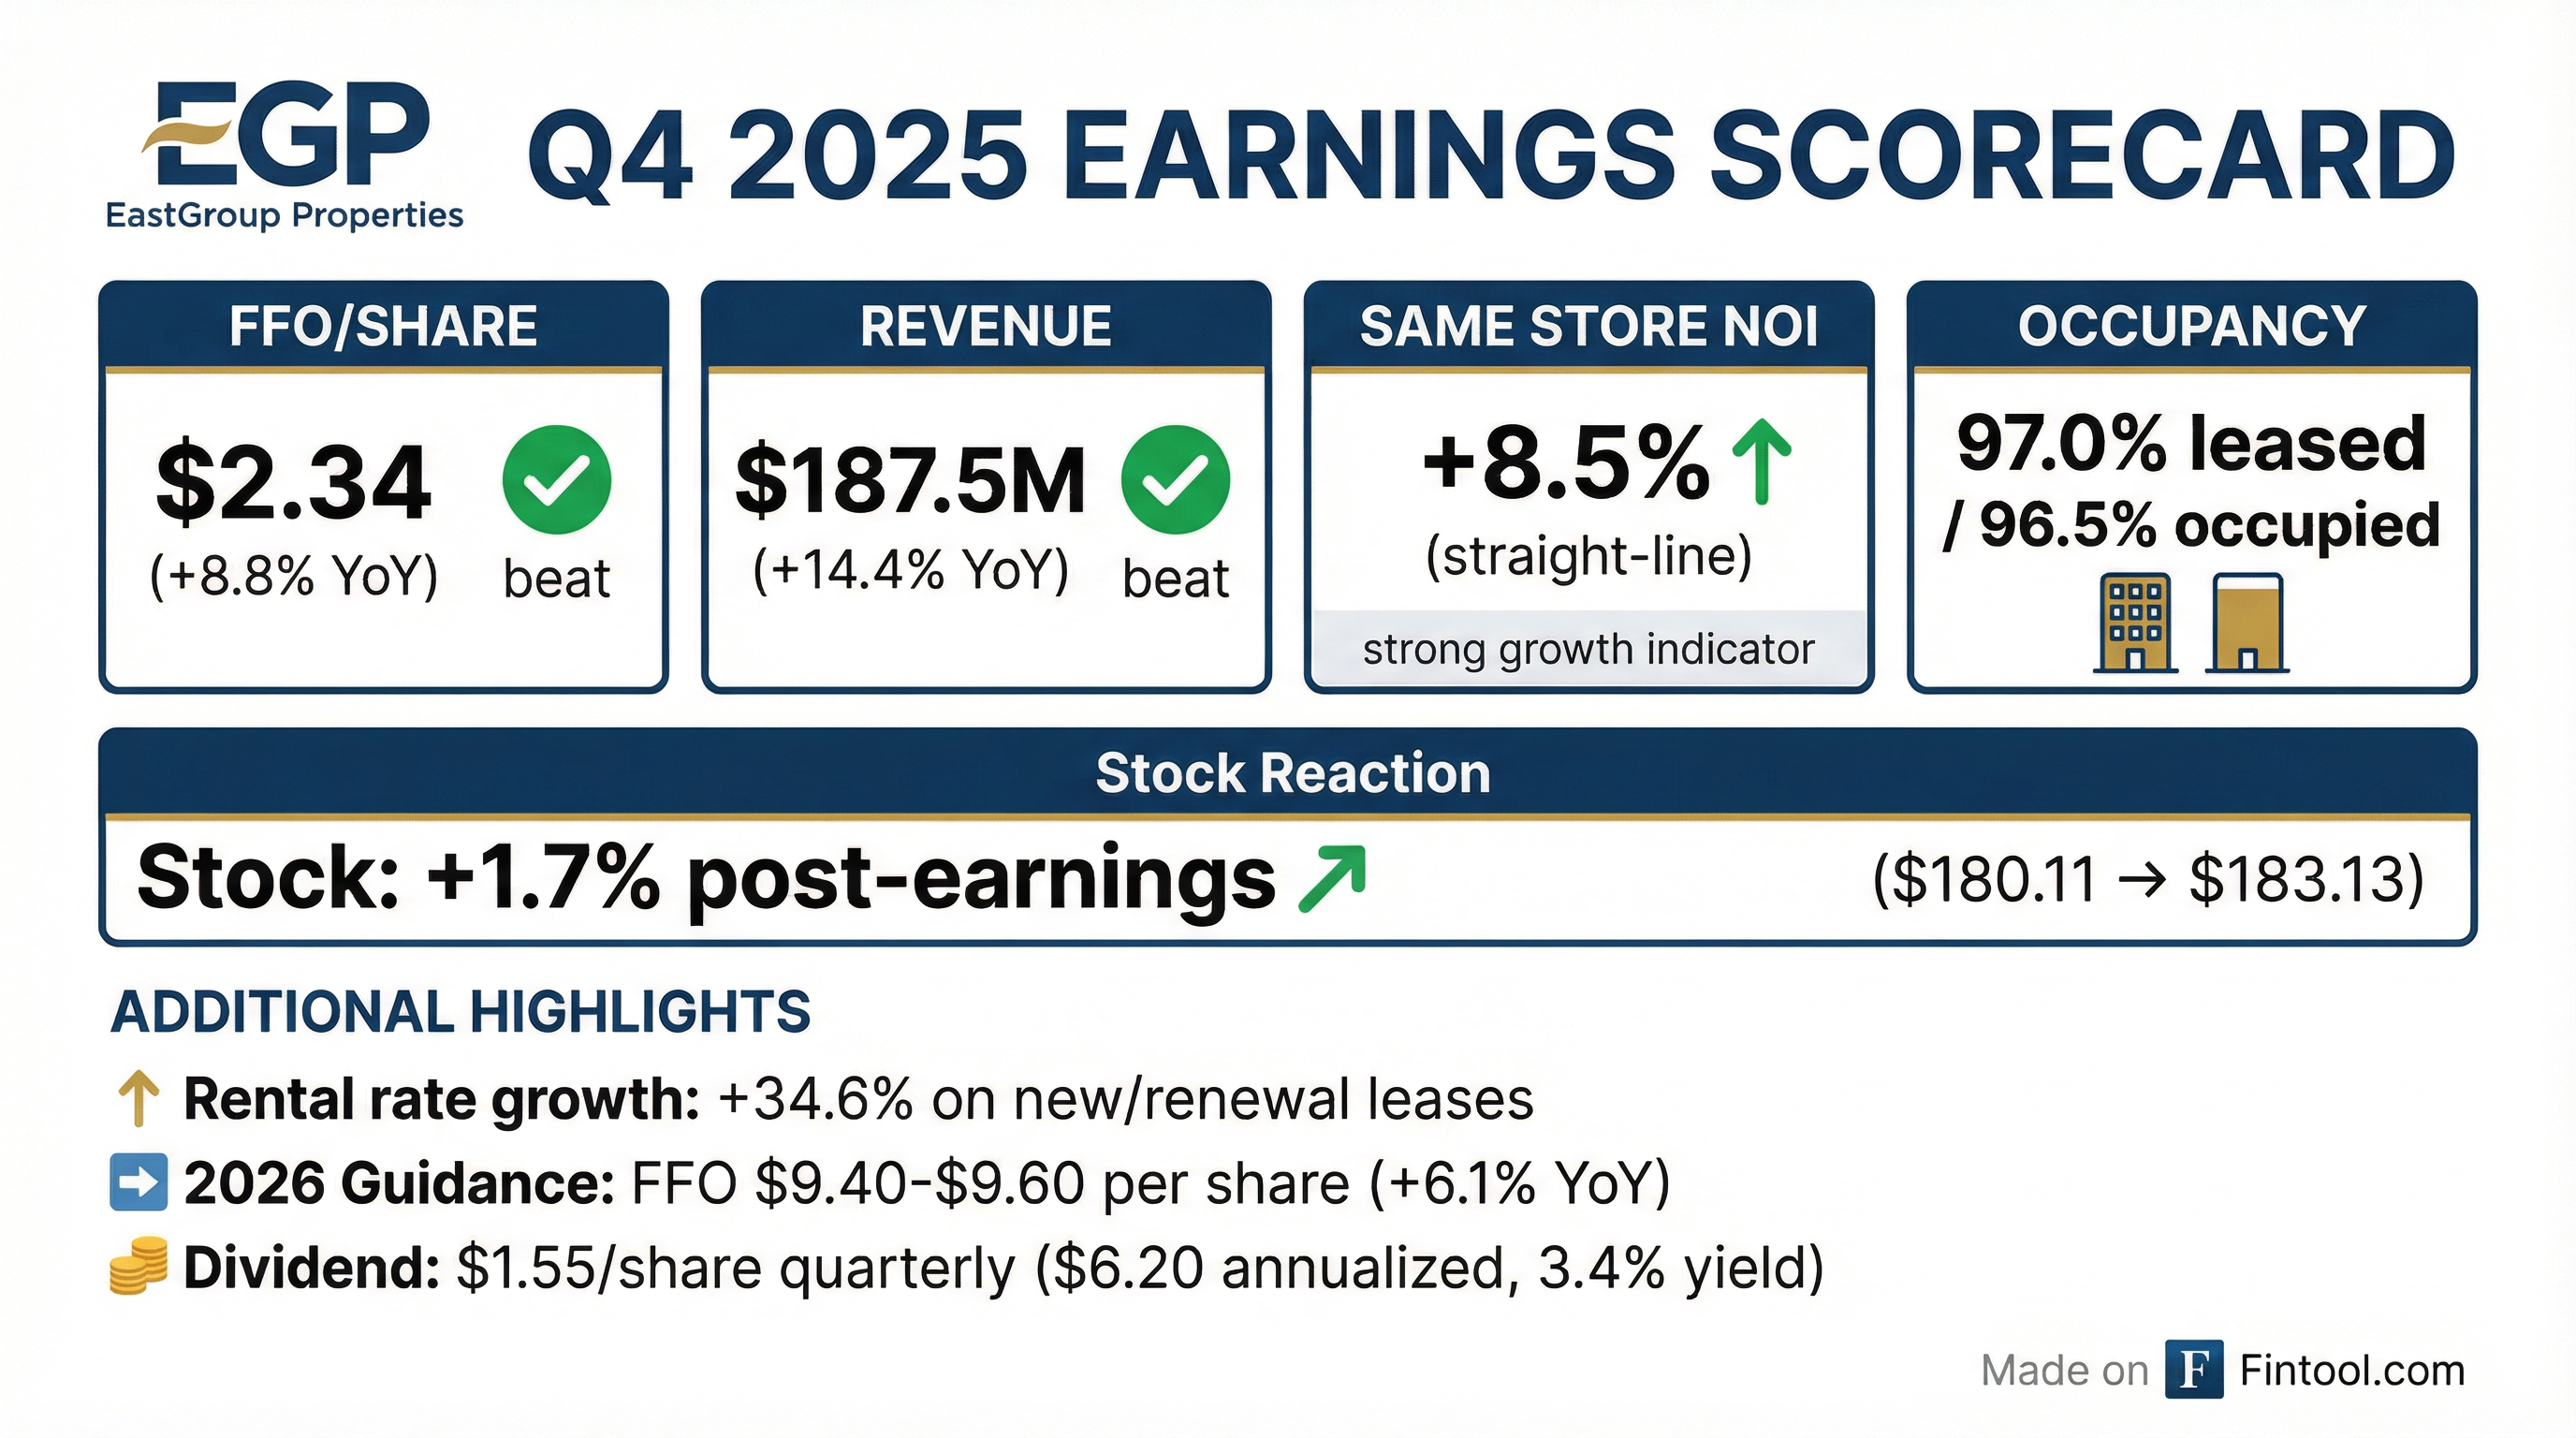
EastGroup Properties (NYSE: EGP) delivered a strong Q4 2025, with FFO of $2.34 per share beating consensus by 4% and marking an 8.8% improvement over the prior year. The Sunbelt-focused industrial REIT benefited from 34.6% rental rate growth on new and renewal leases and maintained occupancy above 96%. Management issued 2026 FFO guidance of $9.40-$9.60 per share, implying 6.1% growth at midpoint.
Did EastGroup Beat Earnings?
Yes — EastGroup beat on both FFO and revenue.
The FFO beat was driven by 14.7% growth in property NOI, with contributions from same-store operations (+$9.5M), acquisitions (+$5.1M), and newly developed properties (+$3.2M).
8-Quarter FFO Trend:
EastGroup has now beaten or met FFO estimates for 12 consecutive quarters.
What Did Management Guide?
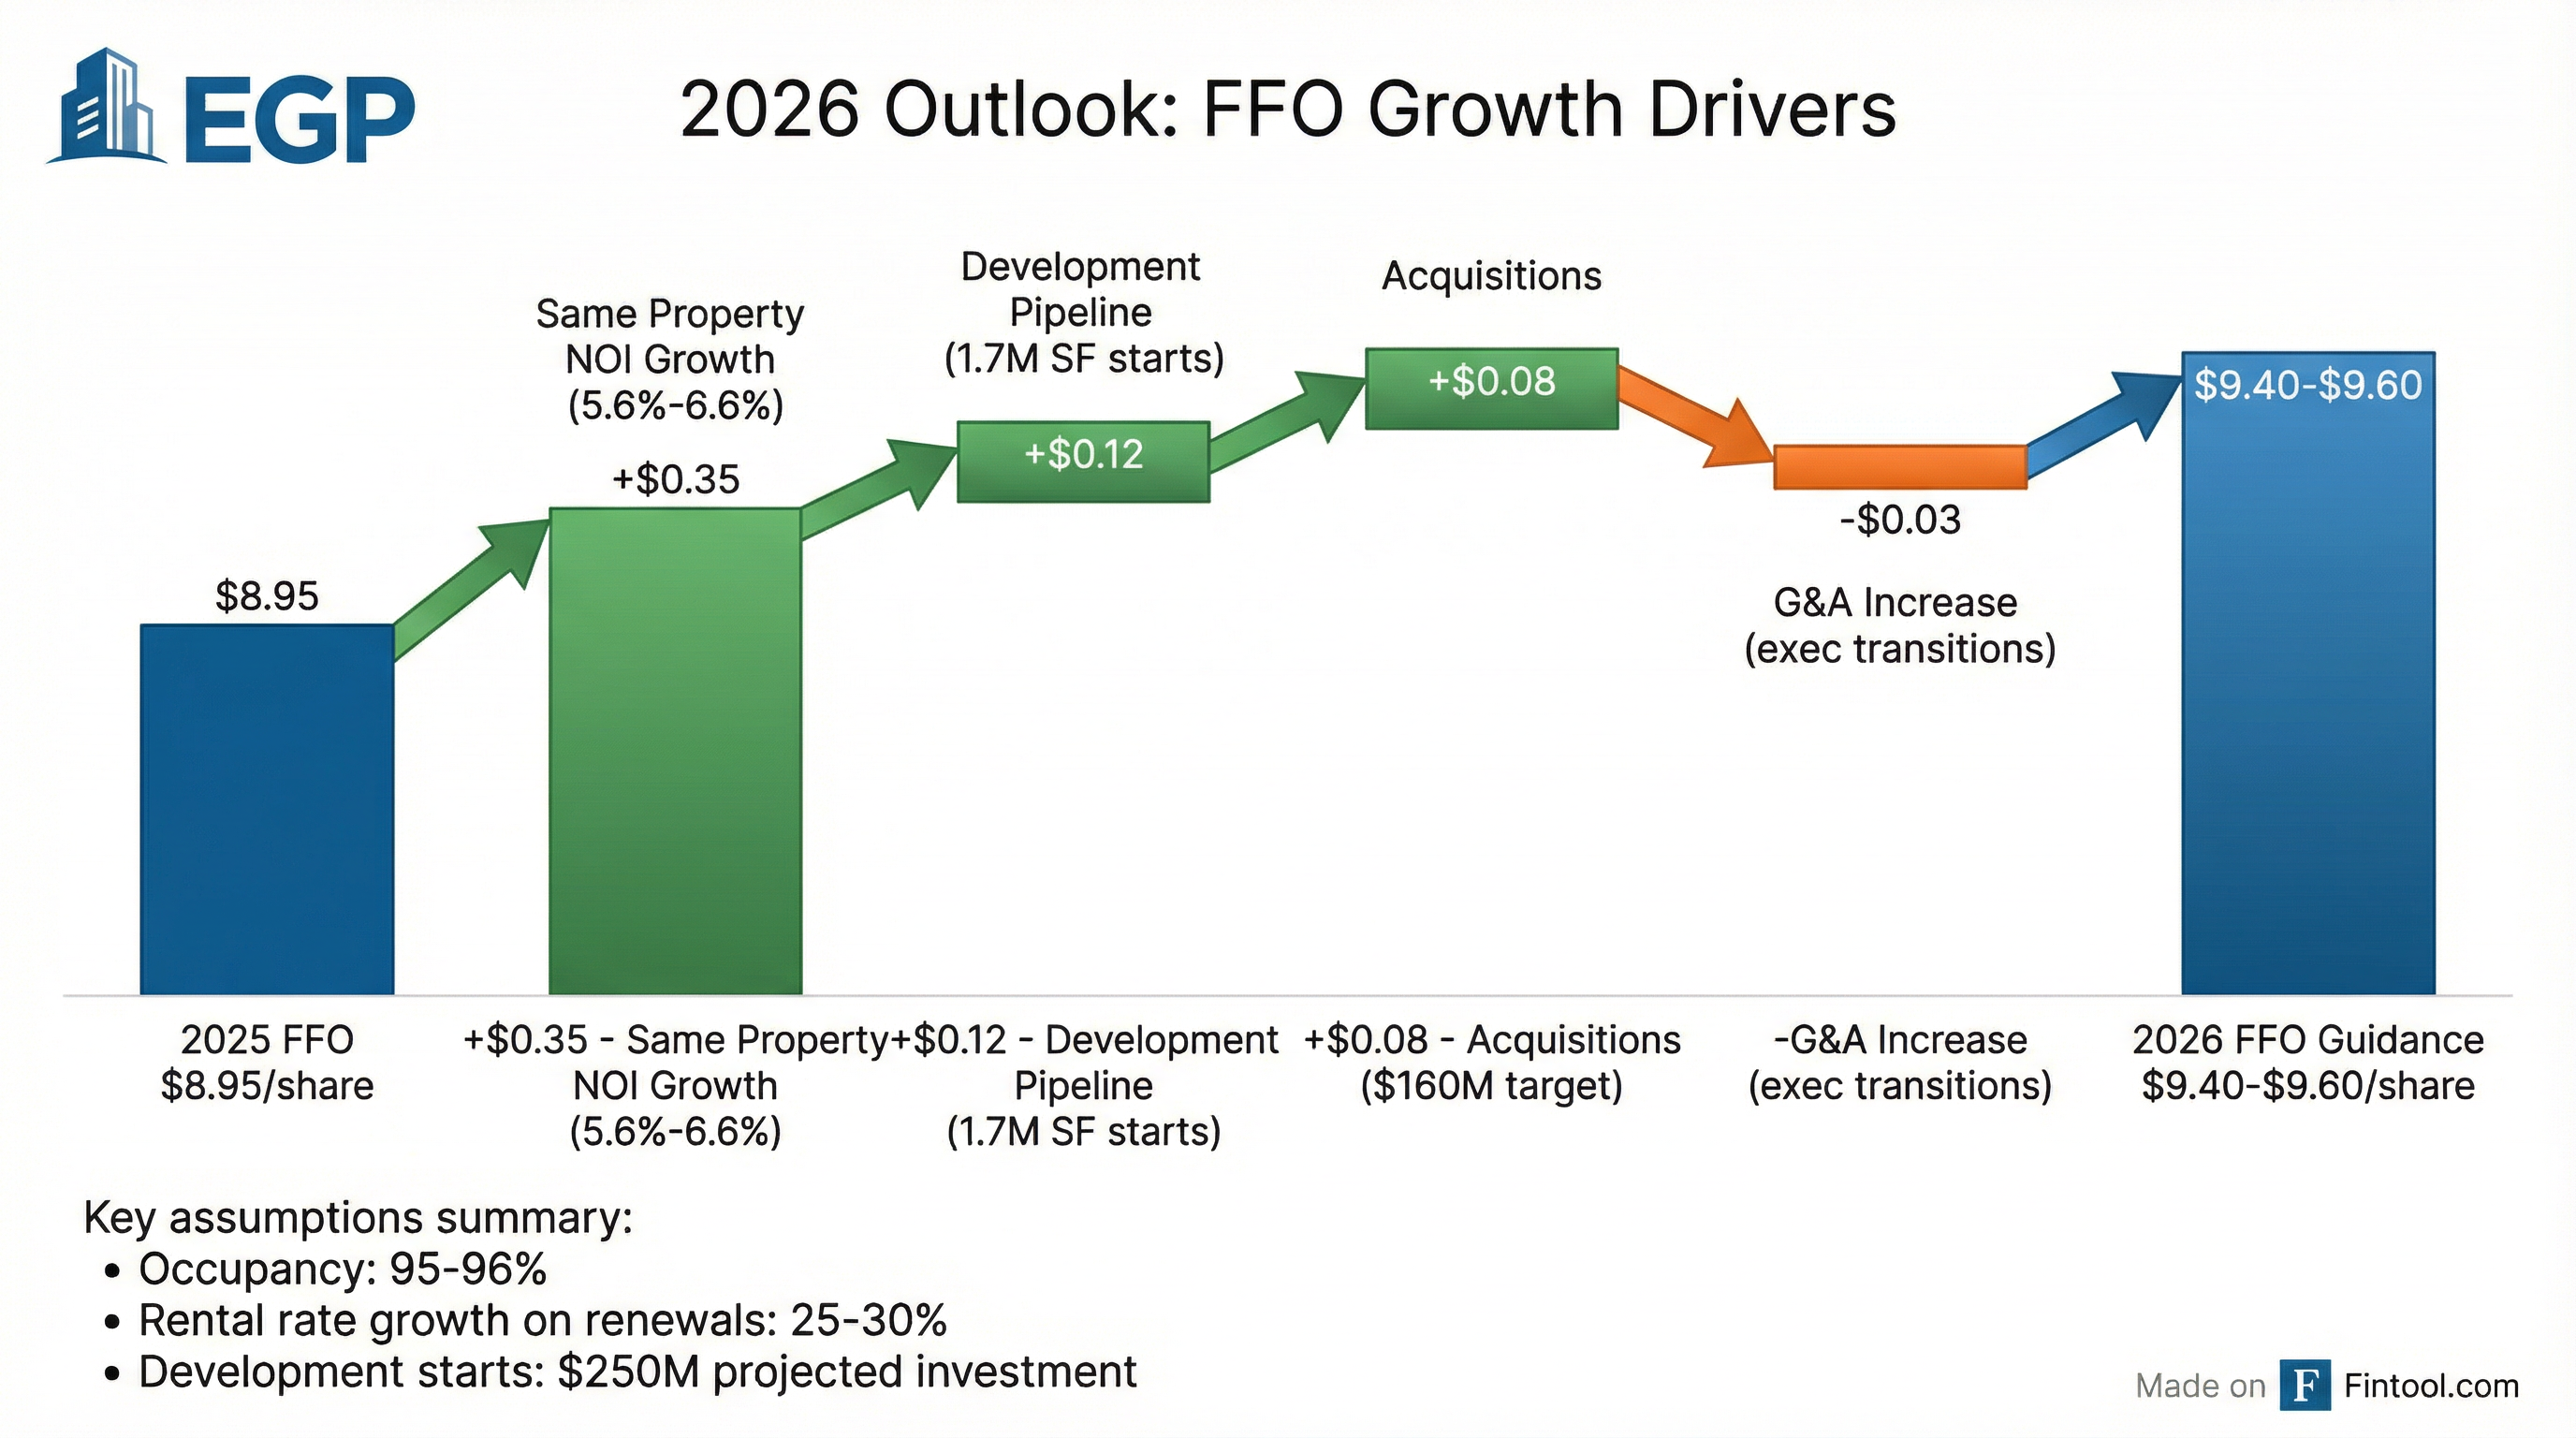
EastGroup provided 2026 guidance that implies continued FFO growth of 5.8%-7.3%:
The guidance midpoint of $9.50 sits above the Street at $9.45, a modest positive signal. Management expects G&A to rise to $27M (from $24M) due to ~$4M in executive transition costs.
What Changed From Last Quarter?
Positive developments:
- Development leasing inflected sharply: Q4 development leasing accounted for 52% of annual square footage — the best quarter in over 3 years. Average lease size jumped to over 60,000 SF, a significant uptick. Management has 6-8 large tenant conversations underway across 6 different states.
- Rental rate growth remained strong: Quarterly re-leasing spreads of 35% GAAP and 19% cash. Full-year spreads of 40% GAAP and 25% cash. Cash same-store rental growth of 8.4% for the quarter.
- Portfolio quality improving: Same-store occupancy hit 97.4%. Top 10 tenants now just 6.8% of rents (down 40 bps YoY), enhancing diversification.
- Executive succession completed: Reid Dunbar promoted to President, Brent Wood to COO, Staci Tyler to CFO — first restructuring in 20+ years as company grew to 62M SF.
Watch items:
- Rent growth not yet materializing: Despite improving demand, Marshall Loeb described pricing as "inflation plus a little bit" — rent growth hasn't caught up to leasing momentum yet.
- Development leasing still back-weighted in guidance: $0.07 per share of spec development leasing assumed in 2026 budget, concentrated in H2.
- Some markets being exited: Fresno closing in weeks, Jackson down to 1 building, New Orleans under review for potential scale-back.
How Did the Stock React?
EGP shares rose +1.7% on earnings day, closing at $183.13 versus $180.11 the prior day. The stock is now trading within 3% of its 52-week high of $188.89.
The reaction reflects relief around guidance that met or exceeded expectations, following concerns about slowing industrial demand in certain markets. EastGroup's Sunbelt focus and shallow-bay positioning continue to differentiate from larger peers.
Key Operational Highlights
Same-Store Performance
The same property pool (54.7M SF) has delivered 7 consecutive quarters of 6%+ NOI growth on a cash basis, demonstrating the embedded rent growth in EastGroup's portfolio as below-market leases roll.
Leasing Spreads by Market
Top performing markets on rental rate increases:
Development Pipeline
EastGroup ended Q4 with 17 development projects totaling 3.5M SF:
- Under Construction: 1.5M SF, $234M projected cost, 10% pre-leased
- In Lease-Up: 1.9M SF, $266M projected cost, 26% pre-leased
- Projected Stabilized Yield: 7.8% (weighted average)
In 2025, EastGroup transferred 2.1M SF of development to the operating portfolio at a 7.2% stabilized yield, with 72% already leased.
What Did Management Say?
"I'm pleased with how we ended the year in terms of FFO per share exceeding our expectations, as well as the development leases we signed. Looking ahead, I'm excited with our recent wave of promotions... With limited supply and anticipated growing demand, we are excited about our pathway." — Marshall Loeb, CEO
"With an exceptional team, a strong balance sheet, best-in-class portfolio and strategic land holdings, we are well positioned to capitalize on future growth opportunities across our markets." — Reid Dunbar, President
Management's tone was constructive, emphasizing the "shallow bay, last mile, high-growth market" positioning as a secular tailwind. The CEO explicitly noted "limited supply and anticipated growing demand" — a bullish setup for industrial landlords.
Q&A Highlights
On Development Leasing Momentum (Craig Mailman, Citi): Marshall Loeb noted Q4 development leasing was 52% of the annual total square footage — the best quarter in over three years. The average lease size jumped to over 60,000 SF, a significant uptick from prior quarters. Management attributed the acceleration to businesses becoming "more accustomed to outside noise" after Liberation Day disruptions.
"We have probably 6-8 conversations in varying stages... where prospects could take a majority of all of a building, a couple of buildings, a pre-lease, kind of build-to-suit opportunity... across about six different states." — Marshall Loeb, CEO
On Rent Growth Outlook (Samir Khanal, Bank of America): Despite improving demand, rent growth has not yet materialized. Loeb described current pricing as "inflation plus a little bit" across most markets, with California as the exception. Construction costs have declined, allowing development yields to hold at low-7s.
On Market Strategy (Ronald Kamdem, Morgan Stanley): EastGroup is actively exiting non-core markets:
- Santa Barbara: Exited
- Fresno: Closing in "a couple weeks"
- Jackson: Down to 1 of 5 buildings
- New Orleans: Potential scale-back ahead
Simultaneously, the company is eyeing Salt Lake City as a potential new market — citing its capital city status, technology presence, and university infrastructure.
On Competitive Supply (Alexander Goldfarb, Piper Sandler): COO Brent Wood emphasized that multi-tenant industrial vacancy nationally is approximately 4.5% — roughly half the rate of big-box space. The land bank of 1,000+ acres with permits in hand positions EastGroup to accelerate development faster than competitors when demand turns.
On Development vs. Acquisition Economics (Ronald Kamdem, Morgan Stanley): Development yields remain at 7.1%-7.3% while acquisition cap rates sit in the low-to-mid-5s — a spread of 180-200 basis points. This explains the company's bias toward development over acquisitions.
On Nearshoring Tailwinds (Jessica Zheng, Green Street): President Reid Dunbar noted increased activity from nearshoring, particularly in Houston and Dallas where advanced manufacturing tenants are seeking higher-power facilities.
Balance Sheet & Capital Position
EastGroup maintains one of the strongest balance sheets in the REIT sector. The company closed $250M in new term loans at a 4.13% weighted average rate and has $1B of capacity remaining under its equity offering program.
Forward Catalysts
Near-term (1-3 months):
- Fresno disposition closing in "a couple weeks" — completing market exit
- Jacksonville acquisition under contract with money at risk
- 6-8 large tenant pre-lease conversations across 6 states in varying stages
Medium-term (3-12 months):
- $250M in development starts planned for 2026, back-end weighted
- Potential Salt Lake City market entry — management cited as new target
- Nearshoring tailwind in Houston and Dallas from advanced manufacturing demand
- Rent growth inflection as supply remains at 7-8 year lows
Risks to monitor:
- Occupancy guidance at 95.0%-96.0% implies drag from development transfers — core portfolio expected flat
- $0.07 per share of spec leasing in guidance is back-end weighted — H1 visibility limited
- Tariff volatility could impact tenant decision-making again, as it did post-Liberation Day
The Bottom Line
EastGroup delivered another solid quarter, with FFO beating estimates by 4% and 2026 guidance coming in slightly above consensus. The Sunbelt-focused industrial REIT continues to benefit from strong rental rate growth (35% on new/renewal leases) and a disciplined development program yielding 7%+ stabilized returns. With leverage at just 3.0x EBITDA and $1B of equity capacity available, EastGroup has ample firepower to fund its growth pipeline.
The stock's 1.7% gain reflects steady execution rather than a major inflection. At 19x forward FFO with a 3.4% dividend yield, EGP trades at a premium to the REIT sector but in line with high-quality industrial peers. The thesis remains: shallow-bay, last-mile industrial in Sunbelt markets is a secular growth story, and EastGroup is executing well against it.
View more on EastGroup Properties | Q4 2025 Earnings Call Transcript Q4%202025)*